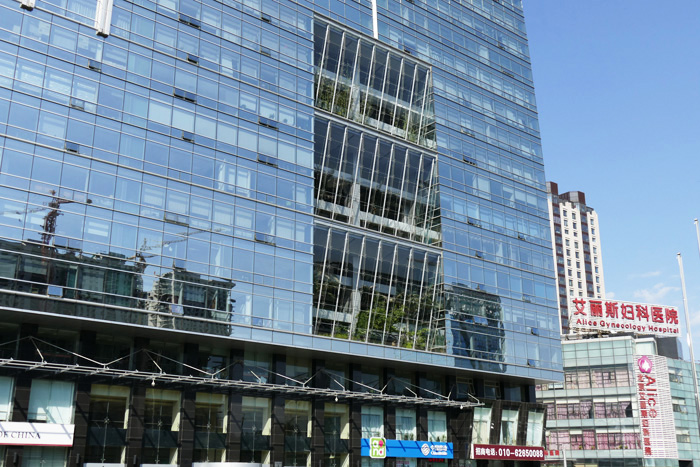
Building holding the Patent Reexamination Board (PRB) of State Intellectual Property Organization (SIPO) at North 4th Ring Road West; Source: By Hermann Luyken (Own work) [CC0], via Wikimedia Commons
The results of a survey of patent holders who held patents which were effective in China as of the end of 2015, was recently published covering 23 of China’s administrative divisions, including provinces, autonomous regions and municipalities.
15,000 surveys of patent holders were sent out, along with 43,000 questionnaires on patents. The response rate was 80%, with more than 70% of responses being valid. The results suggested that the demand for patent protections in China has continued to grow.
In 2016, China handled 48,916 patent-related administrative enforcement cases, up 36.5% year on year. The survey suggested increasing demand for intellectual property right protections from patent holders, and strong hopes for a strengthening of administrative enforcement.
Over 80% of survey respondents stated that intellectual property protections in China should gradually or dramatically increase. Among these, over 60% thought that intellectual property protections should gradually increase, and 20% thought that protections should be dramatically increased. The opinions of different kinds of patent holders were largely consistent. 28% of individual patent holders desired dramatic increases in intellectual property right protections. 56.2% of survey respondents expressed satisfaction with patent protection in China.
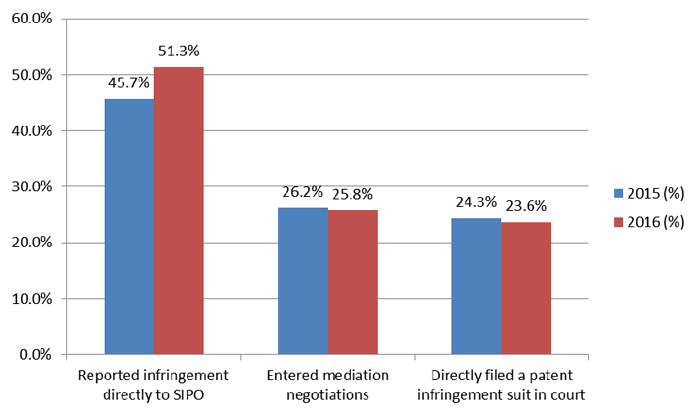
According to the report, more and more patent holders believe that intellectual property authorities should take a more pro-active role in detecting infringing activity. The survey results stated that 61.3% of respondents to the survey believe that the patent authorities should take a more active role in detecting and dealing with patent infringement, up 0.9% year on year; Patent holders who chose to report infringement directly to the State Intellectual Property Office reached 51.3% in 2016, according to the projections of the survey, up 5.6% year on year; while 25.8% chose mediation, and 23.6% chose to sue for patent infringement in court, both the which were down year on year.

Figure 2: A comparison of how patent holders wished to deal with patent infringement in 2015 and 2016;
Source ‘2016 China Patent Survey Conclusions’
In the last five years, surveys have suggested that infringement of patents held by each kind of patent holder has been on a downtrend, hitting a new historical low in 2015. The new figures suggest that patent holders that are businesses and institutes of higher education saw an increase in infringement of their patents in 2016; research institutes and individual patent holders, however, saw a continued decrease in infringement of their patents. The report concluded that there was still a strong need for administrative enforcement in terms of patent rights.

Figure 3: Proportion of infringement of the patents of different kinds of patent holders;
Source ‘2016 China Patent Survey Conclusions’
Burden of Proof Biggest Factor Limiting Patent Protection
The difficulty of providing proof of infringement has dragged down patent holder satisfaction. The survey suggested that the top three issues with which patent holders were dissatisfied with were, “the difficulty of providing evidence”, “the length of time until a judgment is made in a patent case” and “the difficulty of enforcing a judgment”. Among these, over 50% of patent holders who responded to the survey expressed dissatisfaction regarding the burden of proof, whereas 34.3% expressed dissatisfaction with regard to the length of patent infringement proceedings and 27.6% expressed dissatisfaction with the difficulty of enforcing judgments.
Dissatisfaction with judicial patent protection in China in 2016 (%); Source ‘2016 China Patent Survey Conclusions’
|
Businesses |
Institutes of Higher Learning |
Research Institutes |
Individuals |
Overall |
Difficulty of getting a pre-trial injunction |
18.5 |
6.5 |
15.8 |
14.8 |
17.6 |
Difficulty of proving infringement |
52.8 |
56.5 |
53.7 |
49.1 |
52.7 |
Length of proceedings |
34.1 |
35.5 |
31.7 |
36.9 |
34.3 |
Low compensation |
22.0 |
25.7 |
12.0 |
23.3 |
21.9 |
Difficulty in enforcing judgments |
26.4 |
35.2 |
39.0 |
32.2 |
27.6 |
High cost of litigation |
18.2 |
24.8 |
8.7 |
19.4 |
18.2 |
Total |
172.0 |
184.2 |
160.8 |
175.7 |
172.4 |
The survey also focused in on court-awarded damages. Almost 50% of patent holders chose to pursue no damages, while another 28.9% chose to pursue under RMB100,000 (US$14,805), and 18.8% chose to pursue between RMB100,000 and RMB500,000 (US$74,023). According to discussions held by local researchers as part of the survey, the cost of the average lawsuit is between RMB400,000 (US$59,218) to RMB500,000. In the majority of cases, even if the patent holder is successful and is awarded damages, this isn’t enough to cover the costs of the lawsuit.
According to the projections of the survey results, if a company wants to sell a patent it holds, the average expected income from a single patent would be between RMB100,000 and RMB500,000. So the cost of enforcing one’s patent through judicial proceedings can be said to surpass the expected revenue a company would get from selling a patent.
The survey showed that from 2006 to 2016, the Chinese patent implementation rate has been concentrated in the 57% to 75% range. The proportion of patents that had been implemented in 2013 had reached 74.1%, a historic high. From 2014, the rate of patent implementation fell to 69.2%. In 2015, it fell again to 57.9%, a historic low. In 2016 the implementation rate rose again to 61.8%.
The greatest patent implementation rate was found among industry patent holders, at 67.8%. The rate of implementation of design patents was the highest at 65.8%:
Patent implementation in China in 2016 (%); Source ‘2016 China Patent Survey Conclusions’
|
Businesses |
Institutes of Higher Learning |
Research Institutes |
Individuals |
Overall |
Valid Invention Patents |
65.7 |
16.2 |
29.2 |
46.1 |
52.9 |
Valid Utility Model Patents |
68.0 |
11.7 |
38.4 |
34.8 |
62.9 |
Valid Design Patents |
69.1 |
10.1 |
60.9 |
55.6 |
65.8 |
Total |
67.8 |
12.1 |
42.4 |
42.1 |
61.8 |
According to the results of the survey, the rate of patents used for industrial applications (used in manufactured goods and then sold on markets) was 46% in 2016. This rate of industrial application was highest among business patent holders, at 51.5%, and design patents had the highest industrial application rate, at 52.4%:
Industrial application of valid patents in China in 2016 (%); Source ‘2016 China Patent Survey Conclusions’
|
Businesses |
Institutes of Higher Learning |
Research Institutes |
Individuals |
Overall |
Valid Invention Patents |
48.1 |
5.1 |
14.4 |
28.7 |
36.7 |
Valid Utility Model Patents |
50.6 |
3.1 |
20.6 |
22.0 |
46.2 |
Valid Design Patents |
55.8 |
2.4 |
43.6 |
41.1 |
52.4 |
Total |
51.5 |
3.3 |
25.3 |
28.0 |
46.0 |
The survey results suggest that the amount of patents held by a patent holder has an effect on patent implementation, in that it first rises with number of patents, then falls again. In terms of invention patents, patent holders who hold 1-2 patents, have an implementation rate of 55.3%, whereas those who hold 10-29 patents had the highest implementation rate at 64.7%, however those with over 100 patents had an implementation rate of 41.0%.
The industrialization rate has a similar trend in relation to amount of patents held by patent holders. Those with one or two patents have a patent industrial application rate of under 40%, whereas those with 10 to 29 patents have a rate of over 50%, and those with over 100 patents, have a rate of just 40.4%.
Generally speaking the larger the company, the greater their rate of patent implementation. The implementation rate among micro-sized companies for all three patent types, invention patents, utility model patents and design patents, was concentrated in the 50% to 60% range, lower than the implementation rate of all other sizes of companies.
The industrial application rate of both invention patents and utility model patents held by businesses initially increases with business size but then decreases after a certain point, the industrial application rate of design patents are directly correlated with company size.
The results of the survey also suggested that the patent implementation rate of Chinese institutes of higher learning was 12.1%, far lower than the over 60% rate for businesses. The industrial application rate of patents held by institutes of higher learning was just 3.3%, far lower than the 46.0% national average. The patent licensing rate of institutes of higher learning was only 3.3%, below the 8.1% national average. The technology transfer rate of institutes of higher learning was just 1.9%, lower than the 5.4% national average. This suggests that patent implementation and monetization among institutes of higher learning still has a long way to go.
Small and micro-sized companies lack funding and find it difficult to transfer the results of R&D, so there is a heightened risk of their patents being infringed without them having any resort to enforce their rights.
Government monetary support has a clear Matthew Effect on businesses, as bigger companies are more likely to be favored by the government in terms of getting R&D funding and patent subsidies. Large companies receive government funding for their R&D activity at a rate of 50.9%, whereas small and micro-sized companies have the lowest rate of funding from the government at just 35.7%. A similar pattern can be seen with the proportion of patent holders who have received government subsidies for patent applications, with 45.8% of patent holders classified as large companies having received subsidies, compared with 28.1% of patent holders classified as small companies and 29.2% of patent holders classified as micro-companies having received subsidies for patent applications.
Small and micro-companies find it harder than large companies to implement their patents or apply them to industry. However, the survey also suggests that the smaller the company, the smaller the proportion of the technological innovation it undertakes will stray from meeting market needs.
The smaller the company the harder it is for the company to access funding to get the innovation to market.
Micro-sized companies face higher infringement risks. The survey showed that patent holding businesses face 19.5% of infringement. If we take the company size into account, micro-sized companies have the highest rate at 24.5%. The smaller the company, the more likely they are to take no measures when their patent is infringed, with over 50% of companies of this size taking no action after infringement of their patent.
 |
|
| Author: |
Conor Stuart |
| Current Post: |
Senior Editor, IP Observer |
| Education: |
MA Taiwanese Literature, National Taiwan University
BA Chinese and Spanish, Leeds University, UK |
| Experience: |
Translator/Editor, Want China Times
Editor, Erenlai Magazine |
|
|
|
| Facebook |
|
Follow the IP Observer on our FB Page |
|
|
|
|
|
|

