Taiwan H1 2017 Patent Stats
In the first half of 2017 in Taiwan, applications for all three kinds of patents, invention patent, utility model patents and design patents, totaled 35,566, year-on-year growth of 3%, with trademark registrations over the same period totaling 40,390, year on year growth of 6%.
Patent Application Trends in Taiwan
In the first half of 2017, invention patent applications totaled 21,913 and design patent applications totaled 3,959, growth of 6% and 0.4% year on year respectively, whereas utility model applications totaled 9,694, down 2% year on year. (See Table 1):
Patents |
|
|
Q2 |
Cumulative Up to End of Q2 |
2017 |
2016 |
Growth% |
2017 |
2016 |
Growth% |
Overall |
Total |
17,896 |
17,845 |
0.3 |
35,566 |
34,494 |
3 |
Domestic |
10,189 |
10,192 |
-0.03 |
19,327 |
19,018 |
2 |
Foreign |
7,707 |
7,653 |
1 |
16,239 |
15,476 |
5 |
Invention |
Total |
10,739 |
10,316 |
4 |
21,913 |
20,622 |
6 |
Domestic |
4,317 |
3,942 |
10 |
8,086 |
7,447 |
9 |
Foreign |
6,422 |
6,374 |
1 |
13,827 |
13,175 |
5 |
U. Model |
Total |
5,035 |
5,376 |
-6 |
9,694 |
9,927 |
-2 |
Domestic |
4,750 |
5,065 |
-6 |
9,158 |
9,356 |
-2 |
Foreign |
285 |
311 |
-8 |
536 |
571 |
-6 |
Design |
Total |
2,122 |
2,153 |
-1 |
3,959 |
3,945 |
0.4 |
Domestic |
1,122 |
1,185 |
-5 |
2,083 |
2,215 |
-6 |
Foreign |
1,000 |
968 |
3 |
1,876 |
1,730 |
8 |
Trademark |
|
Q2 |
Cumulative Up to End of Q2 |
2017 |
2016 |
Growth% |
2017 |
2016 |
Growth% |
Total |
21,414 |
20,236 |
6 |
40,390 |
38,269 |
6 |
Domestic |
15,931 |
14,794 |
8 |
30,028 |
27,684 |
8 |
Foreign |
5,483 |
5,442 |
1 |
10,362 |
10,585 |
-2 |
Table 1: Patent Applications and Trademark Registrations in H1 of 2017; Source: TIPO website
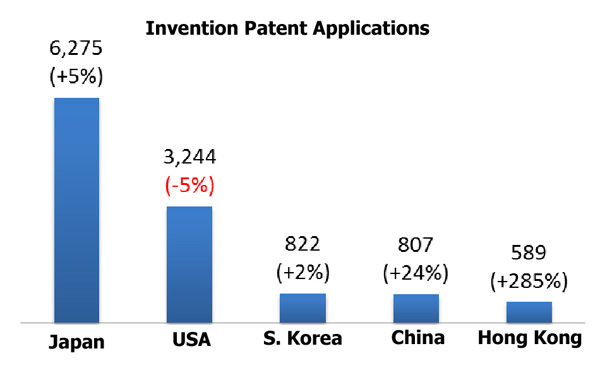
Among invention patent applications, Taiwanese applicants were responsible for 8,086, whereas foreign applicants accounted for 13,827 applications, growth of 9% and 5% respectively. Among foreign applicants, Japanese applicants accounted for the majority of applications, at 6,275, representing growth of 5%, followed by US applicants, accounting for 3,244 applications, representing a decline of 5%, then South Korean applicants, accounting for 822 applications, representing growth of 2%, then Chinese applicants, accounting for 807 applications, growth of 24%, and then Hong Kong applicants, accounting for 589 applications, growth of 285% (See Figure 1).


Figure 1: Top five countries by nationality of applicant for invention patents,
design patents and trademarks in H1 2017; Source: TIPO Press Release
The average time to first office action was reduced to 8.68 months in Q2 of 2017 from 9.23 months in Q1 and average examination time was reduced slightly to 15.45 months in Q2 of 2017 from 15.84 months in Q1.
The top five domestic applicants in terms of invention patent applications were TSMC with 329 applications, Hon Hai Precision Instruments, with 215 applications, Mediatek, with 165 applications, Acer, with 136 applications, and AUO, with 129 applications. The top five foreign applicants were Chinese internet giant Alibaba, with 495 applications, Intel, with 269 applications, Qualcomm, with 266 applications, Applied Materials, with 236 applications, and Japan’s Semiconductor Energy Laboratory, with 222 applications (see Figure 2).

Figure 2: Top 10 domestic and foreign invention patent applicants in Taiwan in H1 2017;
Source: TIPO Press Release
Among domestic invention patent applications, businesses accounted for 5,749 applications and individuals accounted for 1,347 applications in the first half of 2017 year on year, growth of 12% and 6% respectively; institutes of higher learning accounted for 759 applications and research institutes accounted for 231, declines of 2% and 11% respectively. The top institutes of higher learning were National Tsing Hua University, with 56 applications, followed by National Taiwan University, with 39 applications and National Cheng Kung University, with 37 applications.
In terms of trends in patent issuances, 38,525 patents were granted in the first half of 2017, year-on-year growth of 1%. Among these were 25,308 invention patents, showing year-on-year growth of 2%, but utility model patents totaled 9,684 and design patents totaled 3,533, down by 2% and 12% respectively year on year (see Table 2).
Patents |
|
|
Q2 |
Cumulative up to End of Q2 |
2017 |
2016 |
Growth% |
2017 |
2016 |
Growth% |
Overall |
Total |
20,602 |
19,758 |
4 |
38,525 |
38,851 |
-1 |
Domestic |
11,724 |
11,681 |
0.4 |
21,520 |
22,311 |
-4 |
Foreign |
8,878 |
8,077 |
10 |
17,005 |
16,540 |
3 |
Invention |
Total |
13,178 |
12,380 |
6 |
25,308 |
24,933 |
2 |
Domestic |
5,478 |
5,530 |
-1 |
10,531 |
10,773 |
-2 |
Foreign |
7,700 |
6,850 |
12 |
14,777 |
14,160 |
4 |
U. Model |
Total |
5,506 |
5,227 |
5 |
9,684 |
9,901 |
-2 |
Domestic |
5,198 |
4,941 |
5 |
9,124 |
9,346 |
-2 |
Foreign |
308 |
286 |
8 |
560 |
555 |
1 |
Design |
Total |
1,918 |
2,151 |
-11 |
3,533 |
4,017 |
-12 |
Domestic |
1,048 |
1,210 |
-13 |
1,865 |
2,192 |
-15 |
Foreign |
870 |
941 |
-8 |
1,668 |
1,825 |
-9 |
Table 2: Granted patents issued in H1 of 2017 in Taiwan; Source: TIPO Press Release
Among invention patents grants, domestic applicants accounted for 10,531, a decrease of 2% year on year, whereas foreign applicants accounted for 14,777, growth of 4% year on year. Japanese applicants were the largest group of foreign applicants granted patents in the first half of 2017, with 6,470 grants, followed by US applicants, with 3,959 grants, South Korea, with 1,064 grants, China, with 838 grants and Germany, with 677 grants (see Figure 3).

Figure 3: Top 5 countries for patent grants in terms of nationality of applicant in H1 2017
The top five entities in terms of invention patent grants to domestic applicants in the first half of 2017, were Hon Hai Precision Instruments, with 483 grants, TSMC, with 332 grants, the Industrial Technology Research Institute, with 323 grants, AU Optronics, with 261 grants and Macronix, with 154 grants. The top give entities in terms of patent grants to foreign applicants in the first half of 2017, were Intel, with 525 grants, the Semiconductor Energy Laboratory, with 374 grants, Tokyo Electron, with 227 grants, Apple, with 189 grants and Samsung Display, with 182 grants (see Figure 4).

Figure 4: Top 10 domestic and foreign patent applicants granted patents in H1 2017;
Source TIPO Press Release
Trademark Registrations
In the first half of 2017 the Taiwan Intellectual Property Office received 40,390 trademark registration applications, growth of 6% year on year.
China saw the largest number of applications in terms of foreign applicants, at 2,082, followed by Japan, with 1,841, the US, with 1,692, Hong Kong with 713 and South Korea with 668.
China H1 2017 Patent Stats
China’s State Intellectual Property Office (SIPO) also released their patents statistics for the first half of 2017 recently. SIPO spokesperson Hu Wen-hui pointed out three main points concerning the statistics. The first was that invention patent applications saw steady growth, with 8.9 invention patents per 10,000 people in the country (not including Hong Kong or Macao), showing progress towards the goal of 12 invention patents per 10,000 people set as part of the country’s 13th Five-Year-Plan (2016-2020). The second was that key areas for development in China have been deploying patent protections successfully. In the first half of 2017, 230,000 invention patents were held in the national capital region of China, comprising the cities of Beijing, Tianjin and Hebei province, making up 18.7% of all invention patents nationwide, an increase of 23.6% compared with the previous year. 551,000 invention patents were held along the Yangtze River Economic Belt (comprising Sichuan, Yunnan, Chongqing, Hubei, Hunan, Jiangxi, Anhui, Jiangsu, Shanghai, as well as Zhejiang and Guizhou, which surround major tributaries of the Yangtze), comprising 44.9% of the national figure. The third point was that Chinese applications for foreign patents have also seen stable growth, with PCT applications in the first half of 2017 of over 20,000, growth of 15.3%.

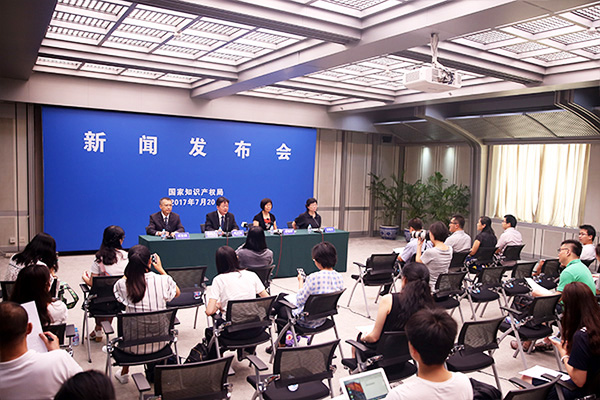
Figure 5: The press conference announcing the H1 statistics in Beijing;
Source: SIPO
The State Intellectual Property Office received roughly 565,000 invention patent applications in the first half of 2017, representing slight growth of 6.1% year on year. The office granted 209,000 invention patents in the same period, with 160,000 of these grants to domestic patent applicants, making up 76.8%, while grants to foreign applicants totaled 48,583 or 23.2%. As of the end of June 2017, 1.2 million invention patents held by Chinese rights holders were in force in China. The top 10 administrative divisions in terms of number of invention patents per 10,000 people were Beijing, with 85.9 invention patents per 10,000 people, followed by Shanghai, with 38.4, Jiangsu, with 20.5, Zhejiang, with 18.1, Guangdong, with 17.5, Tianjin, with 16.5, Shaanxi, with 8.1, Fujian, with 7.1, Liaoning, with 7.0, and Anhui, with 7.0.

Figure 6: Patent applications from domestic and foreign applicants in China in H1 2017

Figure 7: Top 10 administrative divisions in China in terms of number of invention patents per 10,000 people in H1, 2017; Source: SIPO
In the first half of 2017, SIPO received 21,631 PCT applications, representing growth of 16%. The majority of these applications came from Chinese applicants, a total of 20,028, with only 1,603 PCT applications from overseas. Guangdong PCT applications ranked it first in terms of province-level administrative divisions, with Beijing, Shanghai, Shandong and Zhejiang all seeing applications over 500 in number, with these six divisions accounting for almost 90% of PCT applications.
 |
|
| Author: |
Conor Stuart |
| Current Post: |
Senior Editor, IP Observer |
| Education: |
MA Taiwanese Literature, National Taiwan University
BA Chinese and Spanish, Leeds University, UK |
| Experience: |
Translator/Editor, Want China Times
Editor, Erenlai Magazine |
|
|
|
| Facebook |
|
Follow the IP Observer on our FB Page |
|
|
|
|
|
|

